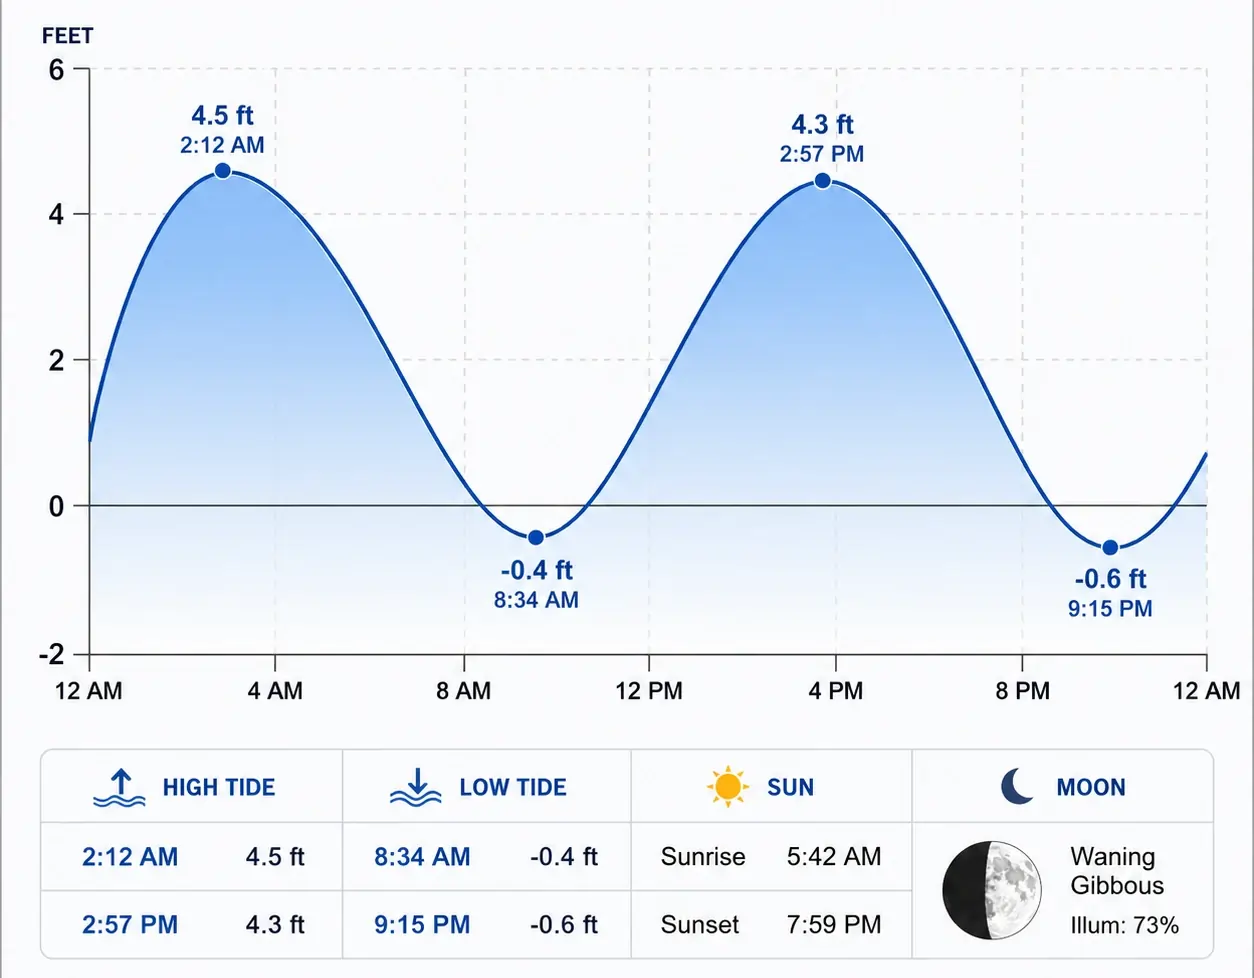
How to read a tide chart — interactive guide for fishing, clamming, and coastal activities
A tide chart is a graph of water height over time. The wavy line tells you when water is high, when it's low, and how fast it's moving between the two — everything a fisher or hunter needs before heading out.
How to read it in four steps
Find the bottom axis — that's time. It runs left to right across a full day, midnight to midnight. Each tick is one hour. Start here — it anchors everything else.
Find the left axis — that's water height. Numbers go up as water gets deeper, measured in feet or metres above chart datum (roughly the lowest possible low tide).
Follow the curve. Peaks are high tides, troughs are low tides. The steeper the slope between them, the faster the water is moving — those windows create strong currents.
Pick your time and read straight up. Heading out at 7:00 AM? Find 07:00 on the bottom axis and trace straight up to the curve. Where they meet is your water height.
Tidal types
Tap a button to see what each tidal pattern looks like and where it occurs.
What the tide is telling you
Tap an activity button to see what to look for on the chart.
Common mistakes
Quick-reference cheat sheet
| What you see on the chart | What it means |
|---|---|
| Peak of the curve | High tide — maximum water depth at that location |
| Trough of the curve | Low tide — minimum depth; flats and rocks may be exposed |
| Steep slope on the curve | Fast-moving water, stronger currents — plan accordingly |
| Flat shoulder near peak or trough | Slack water — tide is turning, minimal current for a short window |
| Height number on left axis | Depth above chart datum, not above the sea floor or ground |
| Two equal peaks per day | Semi-diurnal tide — typical for Atlantic coasts |
| One peak per day | Diurnal tide — typical for Gulf of Mexico |
| Two peaks of different heights | Mixed tide — typical for Pacific coasts |
| Unusually large range this week | Spring tide — near a full or new moon |
| Unusually small range this week | Neap tide — near a quarter moon |
Frequently asked questions
What is a tide chart used for?
A tide chart shows the predicted height of water at a specific location over time — usually a full day or month. Fishers use it to time feeding windows, clammers use it to find low-tide exposure, kayakers use it to avoid strong currents, and anyone working near the water uses it to stay safe.
How do you read the numbers on a tide chart?
The left axis shows water height in feet or metres above chart datum — a fixed baseline roughly equal to the lowest possible astronomical tide. A reading of 0.0 doesn't mean dry ground; it means water is at the baseline. Higher numbers mean more water. The bottom axis is time, running from midnight to midnight.
What is the best tide for fishing?
Most anglers target the two hours before and after high tide on an incoming (flood) tide. Baitfish move onto structure and into shallows as water rises, and predators follow. The middle of the rising tide — where the curve is steepest — is consistently the most active feeding period.
What does mean sea level (MSL) mean on a tide chart?
Mean sea level is the average water height measured over a long period — usually 19 years. It appears as a dashed reference line on the chart. High tide sits above it; low tide sits below. It differs from chart datum, which is set near the lowest possible tide.
What is the difference between a spring tide and a neap tide?
Spring tides occur near a full or new moon, when the sun and moon align and pull together — producing the largest ranges and strongest currents. Neap tides occur near a quarter moon, when the sun and moon pull at right angles — producing the smallest ranges and gentlest flow. On a monthly chart you'll see this as a repeating pattern of bigger and smaller waves.
How accurate are tide charts?
Tide charts predict astronomical tides — the gravitational effect of the moon and sun — with high accuracy, typically within minutes and a few centimetres for well-monitored stations. What they can't predict is weather. Storm surges, strong winds, and pressure changes can push actual levels well above or below the predicted line.
What is a semi-diurnal tide?
A semi-diurnal tide produces two high tides and two low tides each day, spaced roughly 6 hours apart. The two highs are close to equal in height. This is the most common pattern along the Atlantic coast of North America, including Newfoundland, Nova Scotia, and the Maritimes.
Why do tide times change every day?
The moon orbits the Earth roughly every 24 hours and 50 minutes, not every 24 hours. Because tides are driven primarily by the moon's gravitational pull, they shift about 50 minutes later each day. Over a month, high and low tides cycle through every time of day — which is why you need a fresh chart each day rather than reusing yesterday's times.